Six quick style presets are supported for Cartesian charts. These presets let you apply a pre-designed selection of formatting options to the given chart.
Note: Quick styles are not supported for the following Cartesian charts: Marimekko, Open High Low Close, Box and Whisker, Waterfall, and IBCS-like charts. Tornado Charts are Cartesian charts but have their own Quick Styles (separate from those described in this topic).
Select a Quick Style Preset
The quick style presets are displayed on the right of the screen (blue highlight below). Hover your cursor over a preset to view its details.
The examples are for a Column chart.
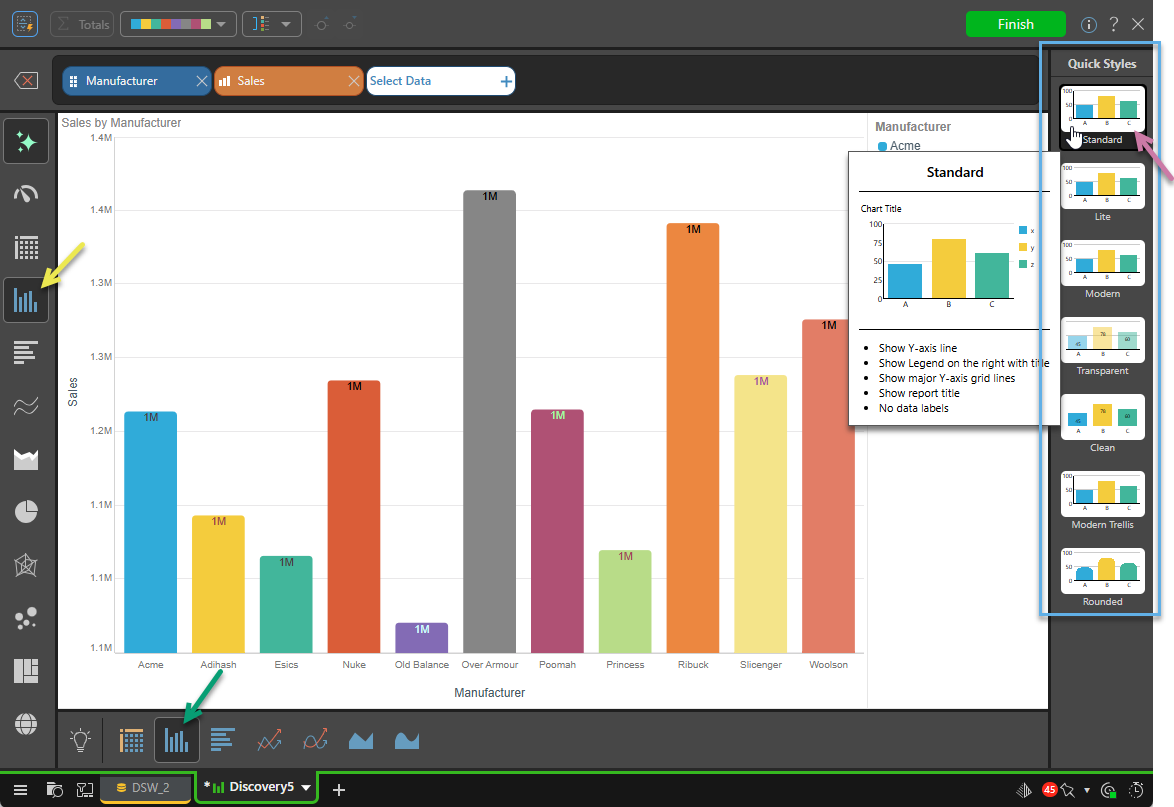
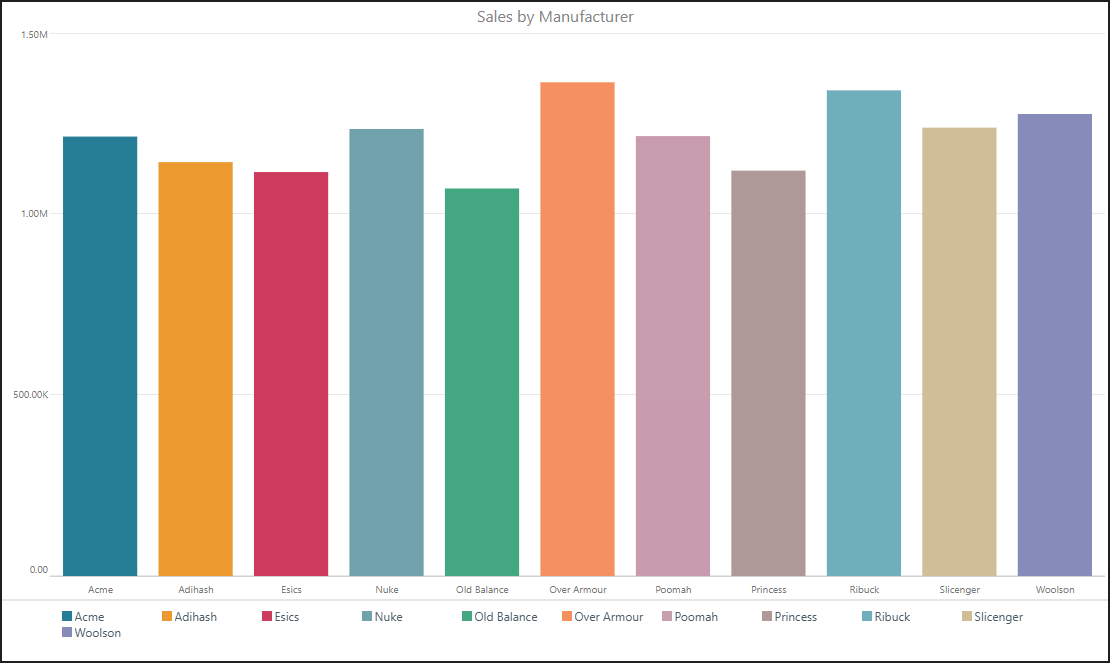
A popular format displaying the most-commonly used information. The chart title is displayed on the left, and the Legend on the right. Data Labels, displaying the actual values, are not displayed.
- Show Y-axis line.
- Show major Y-axis grid lines.
- Show legend and legend title appear on the right.
- Show report title at top left.
- Hide data labels.
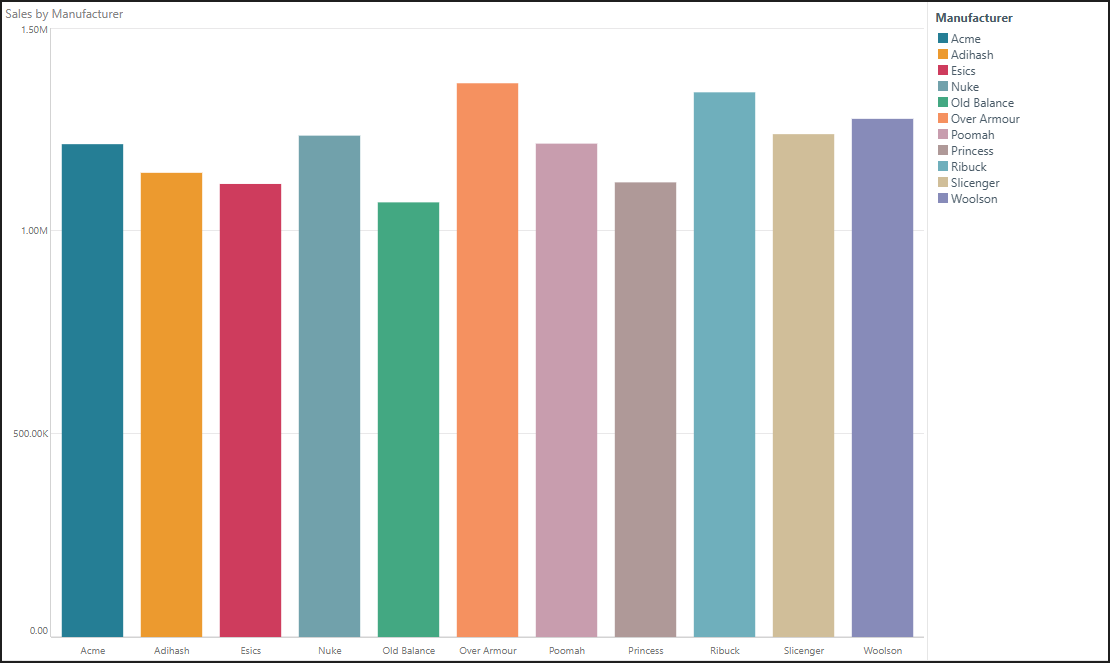
A compact format that is perfect for basic, quick comparisons. The Chart Title, Legend, and Data Labels are not displayed.
- Hide Y-axis line.
- Show major Y-axis grid lines.
- Hide legend.
- Hide report title.
- Hide data labels.
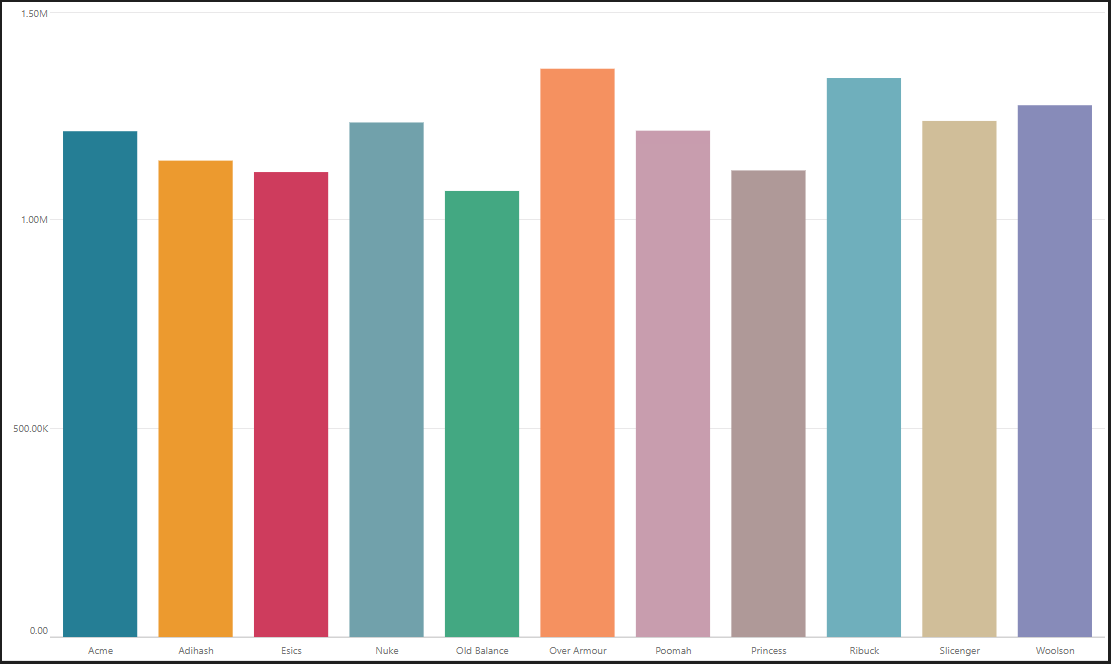
A sharp and compact chart displaying a centered report title and the Legend on the bottom.
- Hide Y-axis line.
- Show major Y-axis grid lines.
- Show legend along the bottom of the visual.
- Hide legend title.
- Center report title at the top of the visual.
- Hide data labels.
A modern, transparent design with preset translucent colors. You can edit the opacity manually in the Theme Editor. This design includes a centered report title and Legend on the bottom. Data Labels are displayed on each column.
- Hide Y-axis line.
- Show major Y-axis grid lines.
- Show legend along the bottom of the visual.
- Hide legend title.
- Center report title at the top of the visual.
- Set chart opacity to 75%.
![]()
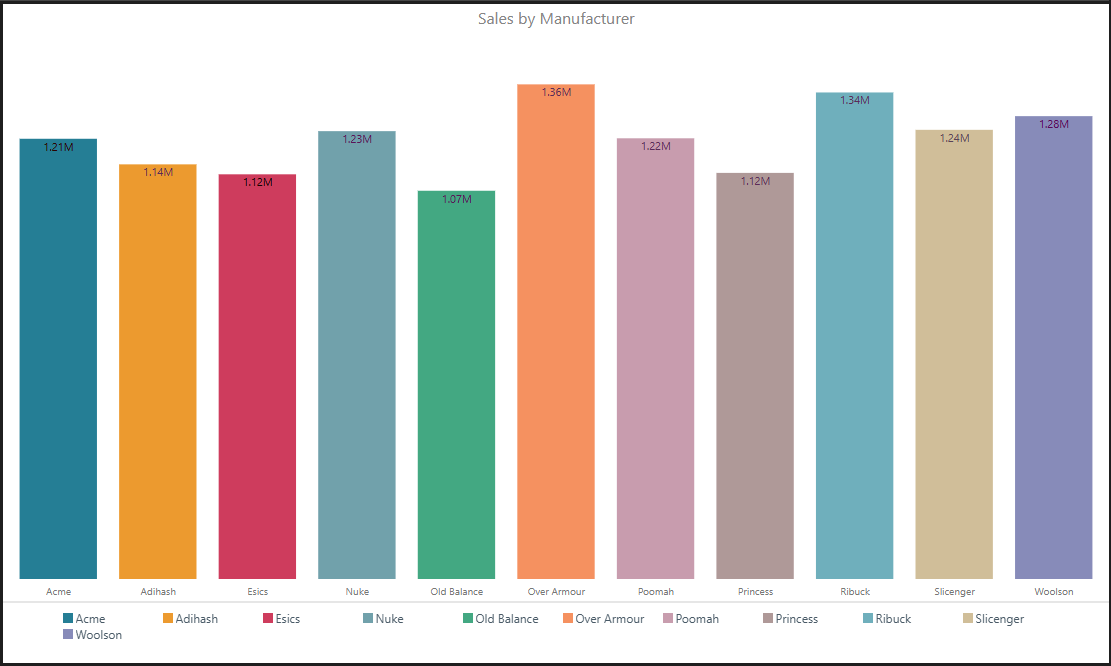
A clean design. This design includes a centered report title, Legends along the bottom, and Data Labels. There are no background "Y-axis" lines.
- Hide Y-axis line.
- Hide X-axis line.
- Hide major Y-axis grid lines.
- Show legend along the bottom of the visual.
- Hide legend title.
- Center report title at the top of the visual.
- Show data labels.
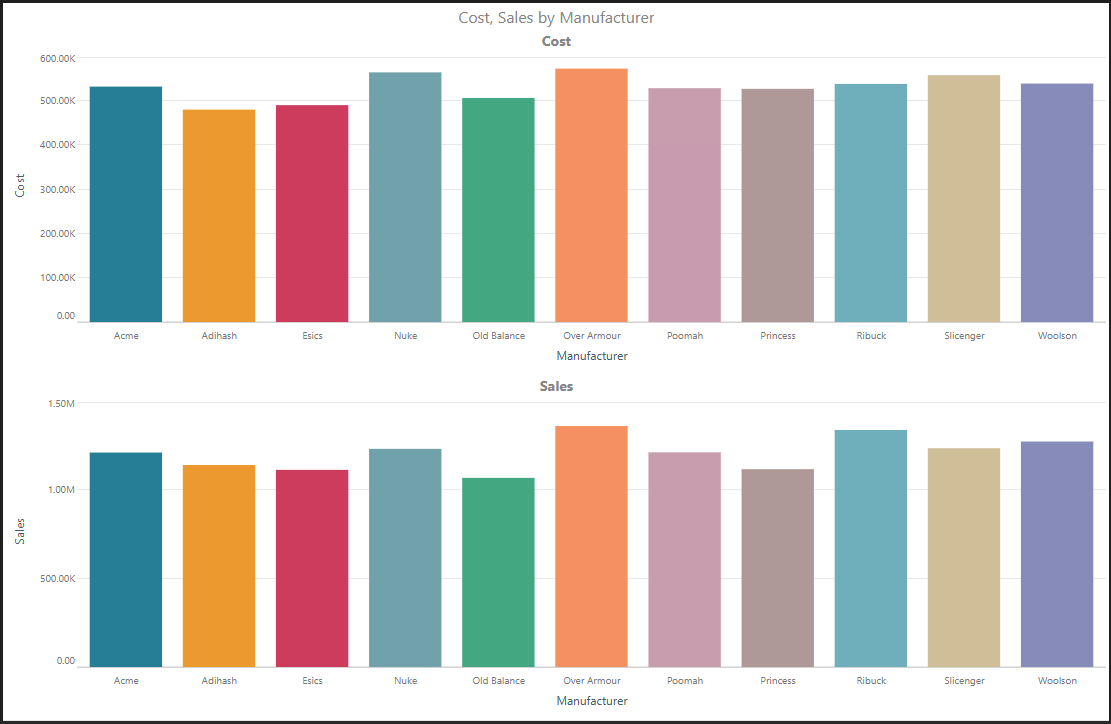
Apply this preset to trellised charts to display centered multi chart titles for each chart in the trellis.
- Hide Y-axis line.
- Hide Y-axis trellis lines.
- Show major Y-axis grid lines.
- Hide legend.
- Center report title at the top of the visual.
- Hide data labels.
A compact chart displaying a centered report title and the Legend along the bottom; this preset also incorporates rounded corners on shapes or lines.
- Hide Y-axis line.
- Show legend along the bottom of the visual without title.
- Show major Y-axis grid lines.
- Show centered report title.
- Hide data labels.
- Rounded corners on shapes (columns in the following example).